First Fall Freeze?

Dennis Todey, South Dakota State Climatologist

Pat Guinan, Missouri State Climatologist

This time of year questions about frost/freeze potential are common as producers look for a little more time for crops to mature, or gardeners and horticultural interests hope for some extra days to collect a few more tomatoes. Projecting specific frost dates are difficult beyond using models out to 1-2 weeks. Thus, climatologies and current crop progress become very important.

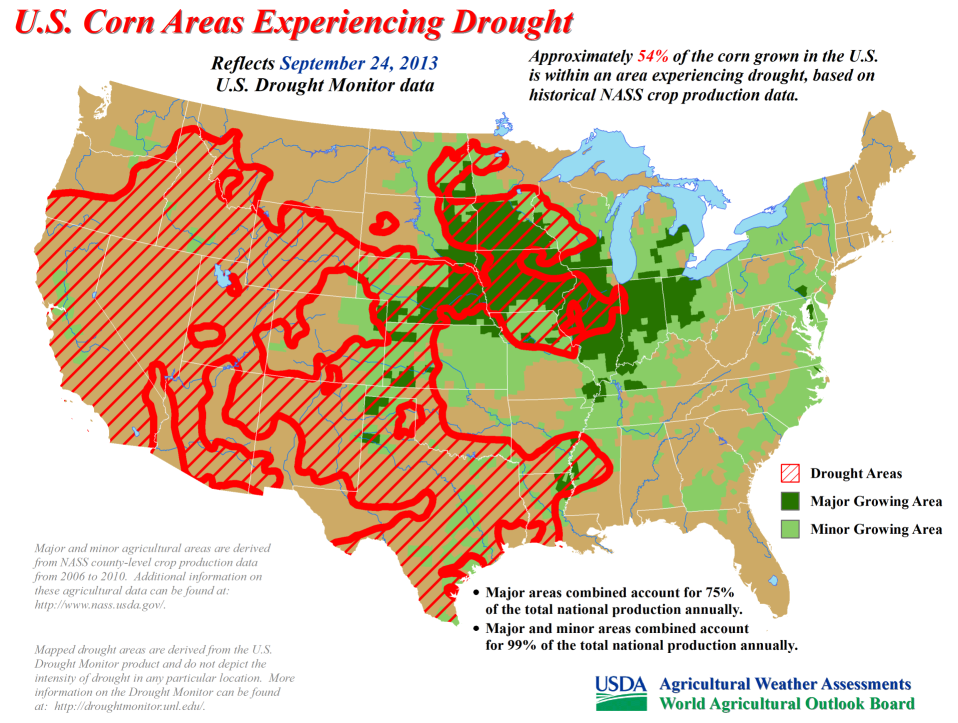
This year, current crop progress varies greatly across the Plains and Midwest because of spring and early summer planting conditions. Early spring in the northern plains/upper Midwest was quite dry allowing easy planting progress and warm soils before rains started occurring in May. This situation was in large contrast to the southern and eastern parts of the Corn Belt. Continue reading

New Outlooks and Impact on the 2015 Planting Season

As we reach the latter part of April the whole Corn Belt is well into planting season, though corn planting progress is a little slow so far. Several contrasting issues are impacting planting across the Corn Belt and into the Northern and Central Plains.

Planting in much of the eastern Corn Belt has been slowed a little by early season wetness particularly in the southeastern parts (Illinois, Indiana, Missouri and Ohio) where heavier than average precipitation over the last 30-60 days has kept conditions wetter, keeping planters out of the fields. Areas in the Ohio River Valley have seen 150-200% of average precipitation or more in the last 30 days. In contrast much of the plains area (Dakotas to Kansas) has seen much drier conditions leading to increase in coverage on the US Drought Monitor.

The wet conditions have slowed corn planting compared to average across the southern and eastern areas of the Corn Belt. Continue reading

NOAA Seasonal Outlook – Cooler in the Northern Corn Belt This Summer?

On June 19, the NOAA Climate Prediction Center released their latest monthly and seasonal outlook of temperature and precipitation for the US. One of the factors that will likely come into play this fall and winter is the developing El Niño event in the Pacific Ocean. Here is the breakdown of the outlooks. Unshaded areas show an equal chance of above, below, or near-average conditions and are labeled “EC”. Click on any map to enlarge.

JULY

There is an increased chance of cooler-than-average conditions in July for eastern Montana and Wyoming, northeast Colorado, western Nebraska, and nearly all of the Dakotas, Minnesota, and Wisconsin. The rest of the Corn Belt is in the “EC” category. At the same time, the Southeast has an increased chance of warmer-than-average conditions.

For precipitation, there is an increased chance of drier-than-average conditions in southern Missouri and Illinois. Meanwhile, there is an increased chance of wetter-than-average conditions in the Rockies and the western portions of the High Plains that could bring some relief to parts of drought-stricken Colorado, Nebraska, and Kansas.

off14_tempoff14_prcp

Continue reading

Is there an advantage to early soybean planting?

Selecting an early versus late planting date could have implications for water availability and plant stress throughout the growing season. U2U team members Tapan Pathak and Roger Elmore at the University of Nebraska-Lincoln looked at the potential advantage of early soybean planting from a climatology perspective. Read all about their findings in Nebraska Crop Watch.

Days suitable for field work in the Corn Belt

Tillage, planting, fertilizer application and harvest all require field work to be completed. The timing and sequencing of these activities are critical for crop development, field dry down and farm profitability. Members of the Useful-to-Usable team have compiled weekly reports of days suitable for field work and planting and harvest progress from the state offices of the National Agricultural Statistics Service to understand the historical trend in days suitable during planting and harvest. An important objective of this research is to construct a predictive model of days suitable as a function of weather and soil type at a given location. We are using historical field work and weather data, together with soil information, to construct a statistical model that explains as much of the variation in historical field work days as possible so that we can use this information in the development of decision support tools to aid farmers in:

  • Selecting what size of machinery to purchase,
  • Determining the risks and rewards of alternative fertilizer application timing, and
  • Predicting how we expect field work days to be different in the future based on predicted climate change.

Over the period from 1980-2010, there is an overall trend towards fewer days suitable per week during the planting period and more days suitable during the harvest period. There are differences across states, as is shown in the table below.

Table UPDATED 8/30/2017

Table 2 Mean Weekly Days Suitable for Fieldwork, 1980-2010


Entire
growing
season

Planting Period1

Harvest period1

State

Mean
(S.D.)

Mean
(S.D.)

Difference between 1980-1994 and
1995-2010

Mean
(S.D.)

Difference between 1980-1994 and
1995-2010

Illinois

4.8
(1.8)

3.7
(1.9)

( – )***

5.2
(1.5)

( + )***

Indiana

4.6
(1.8)

3.5
(1.9)

( – )***

5.1
(1.5)

( + )***

Iowa

4.6
(1.8)

3.8
(1.9)

( – )***

5.0
(1.5)

( + )***

Kansas

4.7
(1.9)

4.1
(1.8)

( + )***

5.0
(1.8)

( + )***

Missouri

4.6
(1.9)

3.5
(1.9)

( + ) **

4.7
(1.8)

( + )***

Table notes: All values are weekly reports of the number of days between 0 and 7, averaged over all USDA Crop Reporting Districts in a given state. ** and *** denote <5% and <0.1% confidence levels for t-tests of the directional (+, -) difference in means between time periods.
1 Weeks when planting and harvest take place each year based on USDA-NASS weekly crop progress and condition reports issued by state NASS offices.


Spring/summer outlook and El Nino

The January long range outlooks were released two weeks ago.  The main themes are continued similar overall pattern is expected into February and possibly into spring.  Colder conditions are more likely in the northern plains with no strong indications on precipitation except for some increased chances in the Ohio Valley.

The more interesting feature in the outlooks is not mentioned in the outlooks directly.  Recent forecasts for El Nino have been showing Continue reading

Fall Crop Harvest Weather, Progress and Impacts

What was possibly going to be a late harvest season with the late planting and cooler mid-summer temperatures has moved ahead quicker than expected.  Late season warmth and dryness pushed crops progress along and also pushed many to premature maturity because of a lack of moisture accompanying the heat in the late summer.  Thus, crops that were expected to stay green well into the fall have not.  A warm and relatively dry September also aided that situation.  Continue reading

Late Season Warmth and Dryness

Much of the Cornbelt experienced conditions warmer and drier than average in recent weeks. Temperatures for the first 25 days of September have been above average in the western two-thirds of the region with the departures becoming stronger moving from east to west. Meanwhile, much of Ohio and Indiana as well as parts of Illinois and Wisconsin have been close to average. After planting delays this spring and the cooler than average conditions that prevailed through mid-August, this late season warmth gave corn an opportunity to at least partially catch up in its development. In addition, it has served as an aid in drydown in those fields that have already reached maturity.

Based on the September 24, 2013, US Drought Monitor, the US Department of Agriculture estimates that 54 percent of the US corn production is in some stage of drought. At this late stage of the growing season, additional precipitation will have little impacts on yields. In fact, any significant precipitation at this point is more likely to be a hindrance as the harvest continues.

map-btd-2

corn-drought

Click to enlarge. Map courtesy of the US Department of Agriculture

Drought issues returning

drmon

The most recent US Drought Monitor map shows drought returning to larger parts of the Corn Belt in the last few weeks. This has been driven by warm temperatures over the last part of August. Dryness has existed across parts of IA, MN and SD over the middle part of the summer. But cool temperatures during that same period had reduced the stress on crops. With the return of warm temperatures in the latter part of August, the dry areas began showing stress quickly.

Areas of Iowa and Missouri have degraded to D2-Severe Drought with surrounding areas of SD, MN, and IA with D1 – Moderate Drought.

In some ways the heat in the latter part of August was welcomed in pushing crops along to development. But the extended period of heat without moisture is stressing crops, pushing some to early maturity and browning.

Large parts of the central part of the corn belt are watching for freezing conditions because of the late development. We will post more about that as information becomes available.

July and August Rainfall in Missouri – The Tale of the Haves and the Have-Nots

Missouri has experienced some large precipitation disparities this summer, ranging from moderate drought to historic flooding. The disparities have been especially notable in August. Some south central counties have received 15-20 inches of rain this month, whereas 120 miles to the north…not a drop.

Several counties across northern Missouri have received less than 2-inches of rain since July 1, which is more than 6-inches below normal. Crop stress has emerged in the driest areas, with some firing and leaf curling reported, more notably in upland areas, or in soils with higher clay or sand content. Cool July and August temperatures, in combination with below normal ET rates, have mitigated full drought stress potential but corn yields are declining due to the current high water demand of late planted corn, and during a critical growth stage. Soybean growth has also slowed down in these drier areas.

Unlike last year, below normal evaporative rates this spring and summer has had less impact on surface water supplies, and they remain mostly adequate despite the extended dry spell across northern Missouri.

For podcast, please visit:

<http://www.radiodeege.com/Podcasts/2013/08/19/july-and-august-rainfall-in-missouri-the-tale-of-the-haves-and-the-have-nots/>

For information on historic flood event across southern Missouri, please visit:

<http://www.crh.noaa.gov/sgf/scripts/localdata.php?loc=appevents&data=2013/2013aug10/summary.htm&format=noprint|nomenu&type=html>