New Website for Regional Corn Nitrogen Rate Calculator

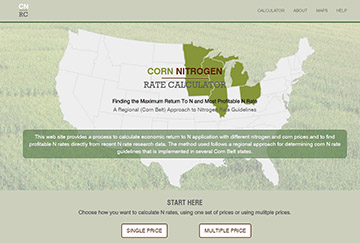
AMES, Iowa – The regional Corn Nitrogen Rate Calculator website, which has been helping farmers determine profitable nitrogen rates since 2005, now has a new URL (cnrc.agron.iastate.edu) and a revised nitrogen response trial database, and is more user friendly for mobile devices.

The largest changes to the website are the updated individual state nitrogen rate response trial database and, for Iowa, the addition of the southeast Iowa region. Nitrogen response trial sites for Iowa are grouped by two geographic regions, which now matches guidelines in the publication Nitrogen Use in Iowa Corn Production (CROP 3073). The publication can be downloaded for free at the online extension store.

“The site revisions allow users to have access to the latest nitrogen rate research, and it offers more tailored rate guidelines in Iowa,” said John Sawyer, professor and extension soil fertility and nutrient management specialist at Iowa State University.

While suggested nitrogen rates may have changed somewhat due to the update, the concept and calculation process of the online tool remains the same. The method continues to be based on a regional approach, providing nitrogen rate guidelines in six states across the Corn Belt: Iowa, Illinois, Michigan, Minnesota, Ohio and Wisconsin.

“The corn nitrogen rate calculator benefits farmers so they can understand needed nitrogen application rates, adjust for different crop rotations, and provide guidance and flexibility in choice of application rate,” said Sawyer. “More importantly, it allows adjustment in rate for changing nitrogen and corn prices.”

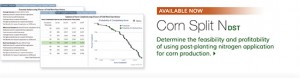
Using the Maximum Return to Nitrogen concept within the CNRC also helps farmers implement the most economical nitrogen rate inputs, which helps moderate water quality issues.

For more information about the CNRC, visit cnrc.agron.iastate.edu.

Corn SplitN Decision Support Tool Now Available in All 12 Corn Belt States

img_cornsplitn_banner2

Now farmers and advisors in all 12 Corn Belt states can use the free Corn-Split N decision support tool, developed by the USDA-funded Useful to Useful climate initiative. The tool helps farmers and advisors manage nitrogen application for efficiency and profit. Corn yield response data from seven new states, together with statistical modeling of days suitable for field work in those states, has recently been added.

Farmers in Illinois, Iowa, Indiana, Missouri, Kansas, Wisconsin, Minnesota, South Dakota, North Dakota, Nebraska, Ohio and Michigan can get customized results based on their planting and fertilization schedule, local costs and available equipment. A summarized fieldwork table and crop calendar makes it easy for farmers to see how schedule adjustments might affect their ability to fertilize on time.

Continue reading

Corn Belt farmers’ attitudes toward responses to increased weather variability

Climate changes and extreme rain and heat/drought events pose significant challenges to the corn and soybean economy in the Midwestern U.S. In the last decade, the intensity and frequency of droughts and floods in the region have increased, with a record loss of 4 billion bushels recorded in 2012. Farm-level adaptation to climate change is a suitable process of adjustments to potential current and future weather variability. Understanding farmers’ attitudes toward their individual and collective efforts to protect land from increased weather variability can provide valuable lessons for agriculture and climate policy makers and agricultural advisors.

In 2012, a farmer survey carried out by the Sustainable Corn Project (USDA-funded project) in partnership with the Useful to Useable (U2U) project asked 4778 corn farmers from 11 Midwestern states about adaptive responses to increased weather variability. In general, most respondents believed that farmers should take steps to make their operations more resilient (click here to see the fact sheet). One thought-provoking result shows that two-thirds of respondents across all states agreed that farmers should take additional steps to prepare for increased weather variability. According to the survey, a majority of farmers are viewing farm-level adaptation as a necessary step for future sustainability of their farms.

Farmers’ attitudes toward responses to increased weather variability varies across a diverse social and biophysical landscape. For improved understanding of this multiplicity, the farmer survey was stratified by watershed, with random samples of farmers drawn in each of 22 HUC6 watersheds. Watershed-level data can help to inform localized outreach programming. The survey data shows that while 58% farmers agreed that they as individuals should take additional steps to protect land against risks posed by increased weather variability. The level of agreement varied across watersheds, from a low of 47% in Loup watershed (Nebraksa) to a high of 70% in Kaskaskia watershed (Illinois). Higher levels of agreement toward responses to increased weather variability could suggest that more farmers are willing to support adaptive actions.

Split Nitrogen (N) Decision Support Tool (DST) – Evaluating the Economics of Conservation

Farmers can conserve nitrogen by applying it when corn can most benefit from its application, reducing nitrogen in the water supply by keeping it in the growing crop.  How can they do so? By applying some to get the crop started and the rest after the corn is out of the ground and actively growing.

The Useful to Usable initiative has developed a new tool for use by farmer, farm managers, and crop advisors that evaluates the feasibility of transitioning to or continuing use of split applications of nitrogen during the growing season.BlogPic1

Farmers who do not sidedress nitrogen on an active crop often do so for multiple reasons. One main concern lies in the uncertainty around having the time to get across all those acres when the weather allows one to do so, before the corn grows too large to put machinery in the field. The Split N DST helps with this risk by using local weather data and fieldwork days compiled by the National Agriculture Statistics Service (NASS), to estimate how likely a farmer can apply nitrogen at sidedress across all his or her acres. Continue reading

There’s still time to collect samples for the cornstalk nitrate nitrogen test

Fall is the time to evaluate corn nitrogen use efficiency by using the end-of-season cornstalk nitrate test. The test measures nitrate-nitrogen left in the corn plant following maturity.

According to the most recent USDA Crop Progress report released on October 27 just 46% of the nation’s corn was harvested so there is still time to collect samples for analysis.  Ideally samples should be collected 1 to 3 weeks after maturity (black layer), however, over the course of 15 years of utilizing the test I have collected samples up to, and immediately after harvest. Post harvest samples can be collected if the corn header is raised high enough to allow an 8-inch stalk segment to be collected starting 6 inches above the ground. If using a head with shredders samples will need to be collected before harvest. Don’t allow stalks that have been harvested to get rained on before collection or nitrates will start washing out of the stalks.

The video provides a demonstration of sample collection and preparation in order to send to a lab for analysis.

Days suitable for field work in the Corn Belt

Tillage, planting, fertilizer application and harvest all require field work to be completed. The timing and sequencing of these activities are critical for crop development, field dry down and farm profitability. Members of the Useful-to-Usable team have compiled weekly reports of days suitable for field work and planting and harvest progress from the state offices of the National Agricultural Statistics Service to understand the historical trend in days suitable during planting and harvest. An important objective of this research is to construct a predictive model of days suitable as a function of weather and soil type at a given location. We are using historical field work and weather data, together with soil information, to construct a statistical model that explains as much of the variation in historical field work days as possible so that we can use this information in the development of decision support tools to aid farmers in:

  • Selecting what size of machinery to purchase,
  • Determining the risks and rewards of alternative fertilizer application timing, and
  • Predicting how we expect field work days to be different in the future based on predicted climate change.

Over the period from 1980-2010, there is an overall trend towards fewer days suitable per week during the planting period and more days suitable during the harvest period. There are differences across states, as is shown in the table below.

Table UPDATED 8/30/2017

Table 2 Mean Weekly Days Suitable for Fieldwork, 1980-2010


Entire
growing
season

Planting Period1

Harvest period1

State

Mean
(S.D.)

Mean
(S.D.)

Difference between 1980-1994 and
1995-2010

Mean
(S.D.)

Difference between 1980-1994 and
1995-2010

Illinois

4.8
(1.8)

3.7
(1.9)

( – )***

5.2
(1.5)

( + )***

Indiana

4.6
(1.8)

3.5
(1.9)

( – )***

5.1
(1.5)

( + )***

Iowa

4.6
(1.8)

3.8
(1.9)

( – )***

5.0
(1.5)

( + )***

Kansas

4.7
(1.9)

4.1
(1.8)

( + )***

5.0
(1.8)

( + )***

Missouri

4.6
(1.9)

3.5
(1.9)

( + ) **

4.7
(1.8)

( + )***

Table notes: All values are weekly reports of the number of days between 0 and 7, averaged over all USDA Crop Reporting Districts in a given state. ** and *** denote <5% and <0.1% confidence levels for t-tests of the directional (+, -) difference in means between time periods.
1 Weeks when planting and harvest take place each year based on USDA-NASS weekly crop progress and condition reports issued by state NASS offices.


State Nutrient Reduction Strategy: Information Midwestern Farmers Can Use

Dick Sloan, an Iowa farmer in Buchanan County, recently wrote to his local newspaper to bring attention to the portion of Iowa’s Nutrient Reduction Strategy that provides tables that assist farmers in making nutrient management decisions. Table 2, for example, on page 6 of the strategy shows the potential impact of certain practices, like cover crops, on reducing nitrate loss and on corn yield based on literature review.  Farmers can see which practices have been shown to be most effective. His article can be found at http://thegazette.com/2014/02/02/good-options-to-choose-from/.  The document to which he refers – Iowa’s nutrient reduction strategy – can be found online at http://www.nutrientstrategy.iastate.edu/sites/default/files/documents/NRS2-130529.pdf.

Decision tools that are useful and usable

Farmers are data hungry. I know because I moonlight as one.  I get eight texts a day just to know what the grain markets are doing.  What is my cost per acre?  How fast did that group of pigs grow?  These are the types of questions I and other farmers are asking themselves all the time.  This fall I finally installed a GPS-enabled yield monitor in my combine.  I couldn’t take my eyes off of it.  Sure, much of what I was seeing I knew already. Some areas are good, some bad, and some are much better or worse than I ever expected.  That real-time data gave me something to think about and will lead to management changes in the future.

This want for data is why I’m excited about the decision tools that the Useful to Usable (U2U) project is developing and has made available at www.AgClimate4U.org.   Continue reading