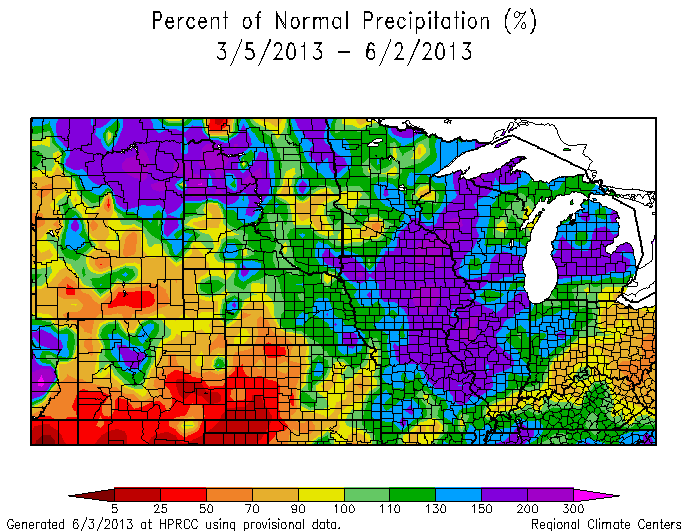
After the very serious drought issues throughout the corn belt during the growing season 2012, the opposite issues are impacting much of the corn belt this season with central parts of the corn belt delayed in planting compared to average and slow developing because of wet field. The following map shows percent of average (normal) precipitation over the last 90 days. Colors in green to blue and shades of purple are wet – purples more than 150% of average (or more than 1.5 times average precipitation). Much of Iowa, Illinois and Missouri as well as western Indiana and southern Minnesota and parts of Wisconsin are the wettest area. Embedded in some of these areas are spots with over 200% of average precipitation (more than double) the 30 year average.
These states are the ones in the main part of the corn belt farthest behind in soybean planting according the USDA NASS reporting today. Through 2 June the three states below are the most delayed in soybeans.
Illinois 49%
Iowa 44%
Missouri 36%
Other surrounding states are well ahead with even Indiana at 76%.
The drier areas surrounding (yellow to red) indicate drier than average conditions over the 90 days leading to better ability to do field work and plant (and where planting progress is more advanced).
Similar deviations show up at nearly all time frames from 30 days back to the beginning of the calendar year. Harry Hillaker, Iowa State Climatologist has reported this being the wettest spring on record (March to May) at 16.65”.
If there is any consolation, it could be worse. If this spring had happened after a particularly wet fall where soil moisture profiles had been completely refilled, conditions (and flooding) would have been more problematic. Because of the dryness last year there was ample storage in the soil moisture profile and in surface water bodies in much of the area.