Lois Wright Morton

Wright-Morton_2014AugLeading a diverse team of scientists and specialists, with USDA’s Sustainable Corn Project, is Lois Wright Morton. In addition to leading the 10-university team, Morton is a farmer, a sociology professor at Iowa State University, and a member of the North American Climate Smart Agriculture Alliance. The USDA recently interviewed her for their series which highlights different leading women in agriculture. Read the interview at http://1.usa.gov/1jYBH39.

Climate & Ag Research by Next Generation Scientists

booklet_shadowLearn about research being conducted, by the Sustainable Corn Project’s graduate students and post-doctoral students, in a new booklet now available for viewing online. Prepared for a poster symposium to be held in Washinton, D.C., October 15-16, the booklet contains 31 research summaries, describing the work of some of the next generation, climate and agriculture scientists, who are currently conducting their research with our project, under the supervision of our Principal Investigators and faculty at participating universities.

See https://sustainablecorn.org/doc/Next_Gen_Scientists.pdf

New atlas shows perspectives on ag practices, decisions, weather info

Capture2
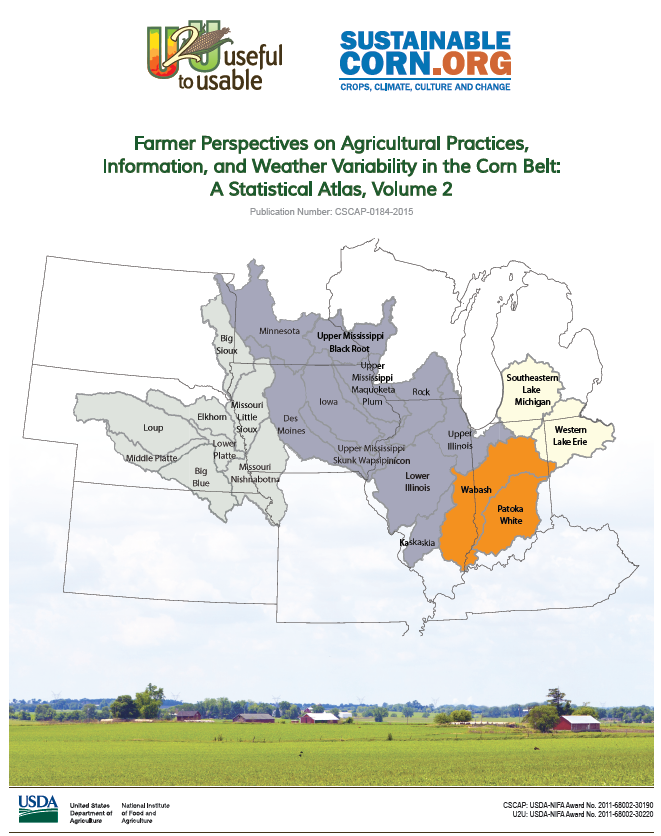
Teams from the Useful to Usable (U2U) and Climate and Corn-based Cropping Systems CAP (CSCAP) projects have released the second atlas in a series presenting data from a survey of Corn Belt farmers that was conducted in early 2012.

Farmer Perspectives on Agricultural Practices, Information, and Weather Variability in the Corn Belt: A Statistical Atlas, Volume 2 looks at farmers’ specific behaviors, beliefs about climate and weather, and the tools they utilize to make farm decisions. Specific information covered includes the timing of farming practices and farming decisions, whether and how farmers use weather information when making farming decisions, a detailed look at the influence of agricultural advisors in farmer decision making processes, farmers’ personal experiences regarding weather and risks, additional information on farmers’ attitudes and beliefs regarding climate change, and plans and efforts of farmers to adapt to and manage for weather and climate variability and risk.

Similar to the first atlas this latest publication provides survey results by watershed, and each section contains a tabulated presentation of survey data along with a series of maps that visually represent the distribution of responses across the entire study region.

This publication is available at https://purr.purdue.edu/publications/1965.

Citation:

Church, Sarah P., Tonya Haigh, Melissa Widhalm, Linda Stalker Prokopy, J. Gordon Arbuckle Jr., Jon Hobbs, Tricia Knoot, Cody Knutson, Adam Loy, Amber Saylor Mase, Jean McGuire, Lois Wright Morton, John Tyndall, 2015. Farmer Perspectives on Agricultural Practices, Information, and Weather Variability in the Corn Belt: A Statistical Atlas, Volume 2. CSCAP-0184-2015. West Lafayette, IN. Purdue University Research Repository. doi:10.4231/R79W0CFS
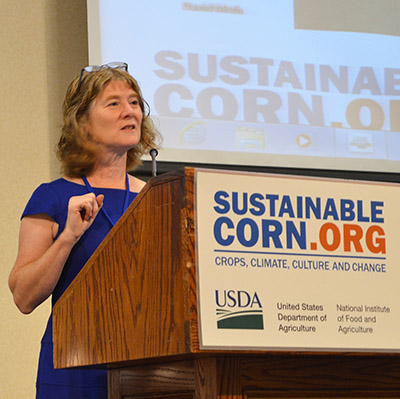
2014 – Warmest Year on Record for World, 15th Coldest for Corn Belt

The year 2014 was considered the warmest year on record for the world, according to three different sources (Japan, NASA, and NOAA). Meanwhile, the Corn Belt experienced the 15th coldest year on record. How can that be?

First of all, here is how 2014 ranked state by state. Many of the Corn Belt states were much below normal, including the three “I” states – Iowa, Illinois, and Indiana as well as Missouri, Michigan, and Wisconsin. It was the 6th coldest year on record for Illinois and in the top 10% for the other states mentioned. The rest of the Corn Belt was below normal as well. Taken together, this was the 15th coldest year on record for the Corn Belt.

201401-201412

National Temperature rankings. NOAA National Climatic Data Center http://www.ncdc.noaa.gov/sotc/national/2014/13

Continue reading

November – December Temperature Swings


The late cold snap in December changed what could have been a rather historic situation, one where average December temperatures were actually warmer than November temperatures.  Data is gradually coming in completing the data for the month of December.  The much colder than average temperatures over the after Christmas have helped to bring down the December averages to close to, but generally slightly cooler than November overall.


To review what happened over the last two months, November started quite warm, but turned very cold in the middle of the month setting a large number of temperature records as sub-0 F temperatures showed up across parts of the Corn Belt mush earlier than usual.  November ended at 6-10 F below average.  The cold carried on into the first part of December when a sharp change occurred with very warm temperatures across the Corn Belt in December with most of the Upper Midwest 4-8 F above average.    See attached images.

Nov14TDeptNWSCR Dec14TDeptNWSCR

Final data are still being accumulated.  Most of the stations around the Midwest and northern plains were within a couple degrees between the two months.  The large majority of stations ended up slightly colder in December than November.  But a few stations largely in northern areas ended up warmer in December than November.

How odd is this situation?  First we have to look at climatology.  There is a range of results across the Corn Belt comparing averages for the two months.  But generally the average difference between November and December is 10-14 F.  So that they are even close show the oddity of the event with November that cold and December that warm.

Has it ever happened?  In some locations, no.  But we can go back to a couple years and find a number of stations where it has happened, 1896 and 1959.  Many stations have both of these with more showing the situation in 1959.

Enjoy the little bit of climatic history.

New Long Range Outlooks – El Nino

The new long range outlooks from NOAA’s Climate Prediction Center were released this week.  There was little new information for much of the Corn Belt except in the shorter term.  Let’s review some of the information included.

For January another major pattern shift is expected from late December into at least early January where a period of colder than average conditions is very likely throughout the Northern Plains/Upper Midwest.  The 30 day outlook for January reflects that cold area with an increased chance of cold temperatures from the Midwest and central Plains southward.  The main issues related to this are on potential winter wheat damage with the cold and to livestock.  There are no precipitation indications different from average during January through the region.

For the 90 day outlook (January – March) the outlooks still bank on El Nino having an impact as the outlooks are largely El Nino-looking.  Specifically this includes cooler temperatures more likely across the southern part of the Midwest, drier than average more likely over the Great Lakes and Ohio Valley and potential for increased precipitation in the central plains.

The current El Nino status is that Sea Surface temperatures are in El Nino territory, but have not persisted as long as needed for classification as an El Nino.  Therefore, El Nino is still pending.  Even if El Nino does occur (current probability is 65%) the impacts are likely weaker because this is going to be a weak El Nino.  Therefore, whether the CPC outlooks will play out is somewhat in question over the 90 day period.

Looking ahead to the planting season there are no strong indications of issues at this point other than the drier than average area in the outlooks over the Great Lakes/Ohio Valley.  Dry soil moisture conditions have impacted much of the corn belt during the fall, which aided harvest.  But these soils will need some recharge come spring.  The eastern Dakotas and much of Minnesota are reflected as Abnormally Dry (D0) on the US Drought Monitor.  At this point most of these issues with dry soils are only potential problems and could actually aid in spring planting allowing soils to warm more quickly and more readily allow field work.  Conditions will have to be monitored for changes during the next few months based on the rest of winter precipitation and early spring rainfalls.

Resilient Ag Conference Videos Now Available

Farmer_Panel_2014In August, over 200 Corn-belt farmers, crop advisors and scientists gathered in Ames, Iowa, to discuss climate uncertainty, impacts on agriculture and what can be done to make the agricultural landscape environmentally healthy and productive. Presentations included the most recent findings by scientists, from 10 land-grant universities and an agricultural research station, who are part of a USDA-supported Cropping Systems Coordinated Agricultural Project, led by Lois Wright Morton, sociology professor at Iowa State. Videos of the conference sessions, including the farmer panel session and remarks by Secretary of Agriculture Tom Vilsack; speaker PowerPoints; posters; Resilient Agriculture Magazine; and other conference handouts are now available for viewing/downloading at www.sustainablecorn.org.

NWS Outlook – Wet October for Northern Corn Belt

Much of the northern Corn Belt has an increased chance of above-average precipitation in October, according to the NWS Climate Prediction Center. This follows on the heels of above-average precipitation over the last 30 days across the Corn Belt.

In the map below, areas shaded in green have an increased chance of above-average precipitation in October and include the Dakotas, Minnesota, Wisconsin, Michigan, Iowa, northern Illinois, and northeast Missouri.

off14_prcp

Continue reading

Corn belt heat into early September

The main part of the Corn belt is going to get some help with heat over the next couple weeks while the northern and western corn belt will hold steady or lose ground compared to average on GDD accumulation.

The 8-14 day outlooks have been consistent over the last few days holding in a ridge of the main part of the corn belt.  This situation will allow above average temperatures during this period.  The additional heat will be very beneficial for the development of corn, which has been lagging a little through the season in certain places.  See the 8-14 day outlook:

http://www.cpc.ncep.noaa.gov/

Northern areas of the Corn belt have been running further behind development throughout the year and have acres that are at risk of not reaching maturity or being harvested at very high moisture content based on the freeze date and additional heat through the rest of the season.

If you wish to check where you corn crop sits with current development check out this tool from the USDA – AFRI funded U2U group:

https://mygeohub.org/groups/u2u/decision_resources

This tool allows you to check development based on your location, planting date and variety.  Updated daily it gives you the chance to check conditions anywhere in the corn belt.

The most recent outlook will not help with the slower development across the northwestern corn belt.  This area will need to have a longer period this fall to reach maturity and dry down.


The Drought Impact Reporter

By Michelle Proctor, Senior Information Specialist, and Pat Guinan, Extension/State Climatologist, University of Missouri

Pat Guinan, University of Missouri Extension climatologist with the Commercial Agriculture Program, encourages people to use the Drought Impact Reporter (DIR) as a way to inform decision makers of drought related impacts experienced across their state. The National Drought Mitigation Center (NDMC) in Lincoln, Nebraska has rolled out newer versions of the online tool over the past few years.

“By contributing information via http://droughtreporter.unl.edu/, we can provide additional impact reports to the Drought Monitor authors, who will then use the information in their weekly drought depiction process,” said Guinan. Continue reading