Climate Camp 2014

amandahooverThe following post is by guest blogger Amanda Hoover.  Amanda is an agriculture teacher and FFA advisor at Continental Local Schools in Continental, Ohio. She is a graduate of South Dakota State University, one of the 10 partner institutions involved in the Sustainable Corn Project.  You can follow Amanda on Twitter: twitter.com/MsAHoover. To learn more about how our Education team is training the next generation of scientists, developing science education curricula and promoting learning opportunities for high school teachers and students through this USDA-NIFA funded project click here.

For many kids, summertime means camp time. During June 2014, this was true for some of their teachers, too! Twenty science and agriculture teachers, including myself, met on the campus of Iowa State University campus for Climate Camp.

Sponsored by the Sustainable Corn Project, the camp was a great opportunity for teachers, climate experts, and sustainable agriculture experts to network and learn from one another.  One of my favorite things about being an agriculture teacher is the ‘family’ atmosphere within the profession. I love attending events to not only meet other Ag teachers, but also to learn from them. Having the chance to interact with science teachers, and helping them understand the vast connections between science and agriculture, and how they can incorporate ag into their curricula, was an added bonus! Continue reading

Share

    NOAA Seasonal Outlook – Cooler in the Northern Corn Belt This Summer?

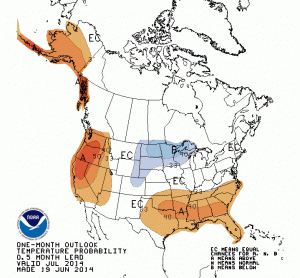
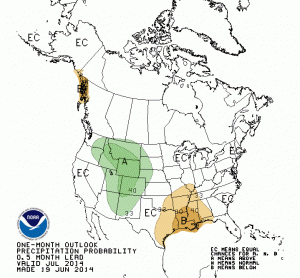
    On June 19, the NOAA Climate Prediction Center released their latest monthly and seasonal outlook of temperature and precipitation for the US. One of the factors that will likely come into play this fall and winter is the developing El Niño event in the Pacific Ocean. Here is the breakdown of the outlooks. Unshaded areas show an equal chance of above, below, or near-average conditions and are labeled “EC”. Click on any map to enlarge.

    JULY

    There is an increased chance of cooler-than-average conditions in July for eastern Montana and Wyoming, northeast Colorado, western Nebraska, and nearly all of the Dakotas, Minnesota, and Wisconsin. The rest of the Corn Belt is in the “EC” category. At the same time, the Southeast has an increased chance of warmer-than-average conditions.

    For precipitation, there is an increased chance of drier-than-average conditions in southern Missouri and Illinois. Meanwhile, there is an increased chance of wetter-than-average conditions in the Rockies and the western portions of the High Plains that could bring some relief to parts of drought-stricken Colorado, Nebraska, and Kansas.

    off14_tempoff14_prcp

    Continue reading

    Share

      Working for a more Resilient Agriculture

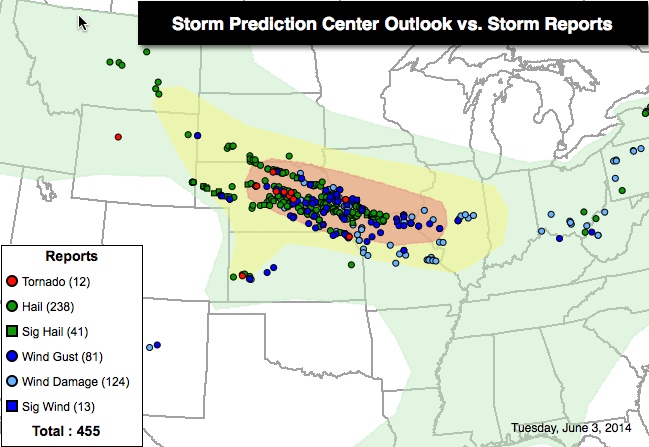
      On June 3 a strong storm system moved across Nebraska, South Dakota, Iowa, Kansas, Missouri, and Illinois with large hail and heavy rain. The storm was significant enough to make the national news with the National Weather Service reporting large hail, winds up to 85 mph and rainfall in excess of 4 inches.

      Storm Prediction Center - http://www.spc.noaa.gov/

      Storm Prediction Center – http://www.spc.noaa.gov/

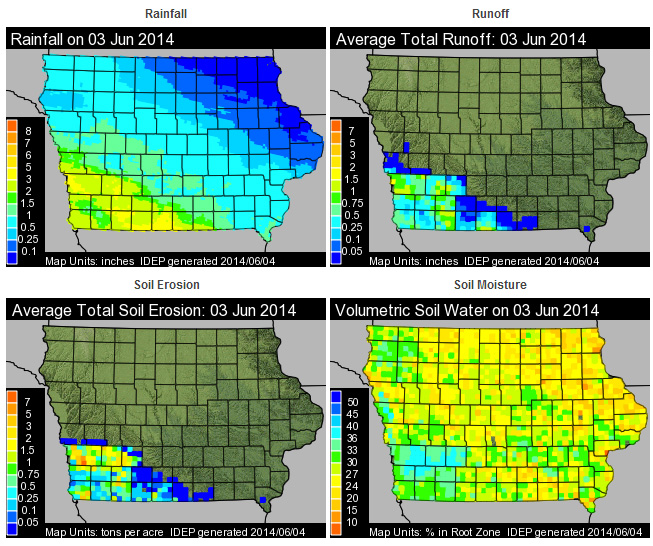
      The Iowa Daily Erosion Project showed localized soil erosion nearing 7 tons per acre from this one storm event in southwest Iowa.

      Iowa Daily Erosion Project - June 3, 2014

      Iowa Daily Erosion Project – June 3, 2014

      The soil loss was so significant that Jon Bakehouse, a southwest Iowa farmer, was moved to write the following on the Practical Farmers of Iowa cover crop listserve.  Continue reading

      Share

        What would the return of El Niño mean for Midwestern farmers?

        Check out Jim Angel’s article regarding predictions of the possible return of El Niño this summer and what it could mean for the Midwest, on his blog at The Climate Observer.

        Want to know more about climate patterns like this? U2U is in the final stages of developing a farmer-decision tool called Climate Patterns Viewer. It will provide a series of simple maps showing the impact of global climate patterns like El Niño on Midwestern temperature, precipitation and corn yields. They expect to release it this summer. If you are interested in testing this tool please contact Melissa Widhalm at mwidhalm at purdue dot edu.

        Share

          Web-based Corn Growing Degree Day Tool helps with planting decisions

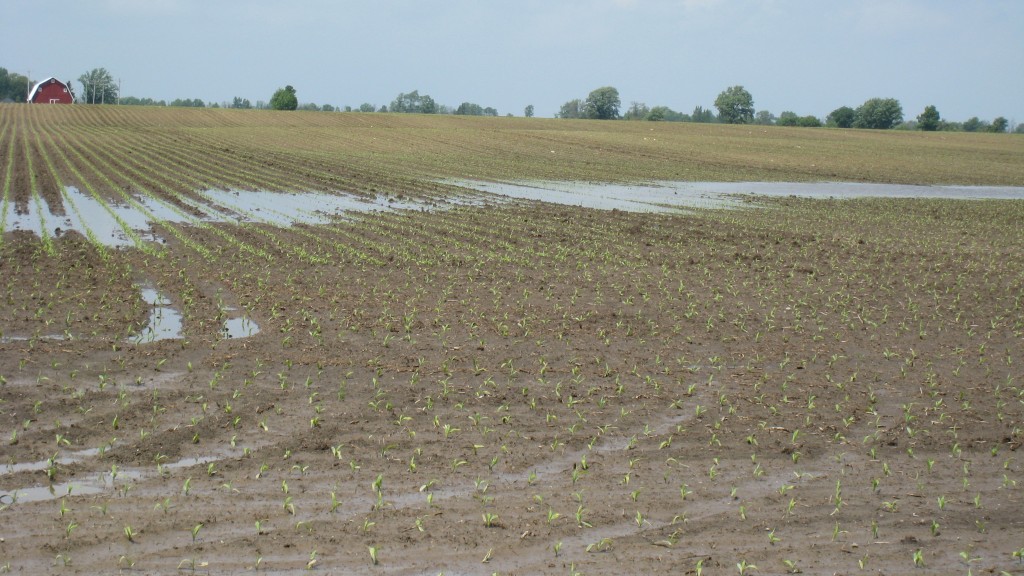
          Another cool wet spring in Michigan leaves farmers waiting for good conditions to plant crops.  Variable weather in the spring always dictates planting schedules.  This year is no different.  Recently a web-based decision tools was developed that allows farmers to compare current conditions to a 30-year historical perspective.  Using historical climatology based data, the tool offers trend projections through the end of the growing season.

          The U2U Decision Support Tool for Corn Growing Degree Days (GDD) allows the producer to select their geographic area; the start date for GDD, this could be the date corn is planted or emerges; the year the grower would like to compare to; corn maturity days; and the temperature for killing frost (28F).  u2u_tools Continue reading

          Share

            Is there an advantage to early soybean planting?

            Selecting an early versus late planting date could have implications for water availability and plant stress throughout the growing season. U2U team members Tapan Pathak and Roger Elmore at the University of Nebraska-Lincoln looked at the potential advantage of early soybean planting from a climatology perspective. Read all about their findings in Nebraska Crop Watch.

            Share

              Suggestions for Young Farmers?

              This spring I had the pleasure of interviewing a diverse group of established cash crop farmers for a Sustainable Corn Project video. These farmers strongly recommended purchasing crop insurance. Farmers run the risk of losing a large amount of money in just one or two growing seasons, but crop insurance will help cover this potential loss. These farmers also emphasized stewardship: taking good care of the soil for profitability, for sustainability, and for future generations who will farm that soil. Some of these farmers also suggested that young farmers consider farm management practices that build crop resiliency to minimize the potential impacts of extreme weather.

              What advice would YOU give to young farmers? What would you tell a young person who wants to go into farming in the future? (Click on the “conversation bubble” above or leave a comment below to share a suggestion.)

              Share

                Days suitable for field work in the Corn Belt

                Tillage, planting, fertilizer application and harvest all require field work to be completed. The timing and sequencing of these activities are critical for crop development, field dry down and farm profitability. Members of the Useful-to-Usable team have compiled weekly reports of days suitable for field work and planting and harvest progress from the state offices of the National Agricultural Statistics Service to understand the historical trend in days suitable during planting and harvest. An important objective of this research is to construct a predictive model of days suitable as a function of weather and soil type at a given location. We are using historical field work and weather data, together with soil information, to construct a statistical model that explains as much of the variation in historical field work days as possible so that we can use this information in the development of decision support tools to aid farmers in:

                • Selecting what size of machinery to purchase,
                • Determining the risks and rewards of alternative fertilizer application timing, and
                • Predicting how we expect field work days to be different in the future based on predicted climate change.

                Over the period from 1980-2010, there is an overall trend towards fewer days suitable per week during the planting period and more days suitable during the harvest period. There are differences across states, as is shown in the table below.

                Table UPDATED 8/30/2017

                Table 2 Mean Weekly Days Suitable for Fieldwork, 1980-2010


                Entire
                growing
                season

                Planting Period1

                Harvest period1

                State

                Mean
                (S.D.)

                Mean
                (S.D.)

                Difference between 1980-1994 and
                1995-2010

                Mean
                (S.D.)

                Difference between 1980-1994 and
                1995-2010

                Illinois

                4.8
                (1.8)

                3.7
                (1.9)

                ( – )***

                5.2
                (1.5)

                ( + )***

                Indiana

                4.6
                (1.8)

                3.5
                (1.9)

                ( – )***

                5.1
                (1.5)

                ( + )***

                Iowa

                4.6
                (1.8)

                3.8
                (1.9)

                ( – )***

                5.0
                (1.5)

                ( + )***

                Kansas

                4.7
                (1.9)

                4.1
                (1.8)

                ( + )***

                5.0
                (1.8)

                ( + )***

                Missouri

                4.6
                (1.9)

                3.5
                (1.9)

                ( + ) **

                4.7
                (1.8)

                ( + )***

                Table notes: All values are weekly reports of the number of days between 0 and 7, averaged over all USDA Crop Reporting Districts in a given state. ** and *** denote <5% and <0.1% confidence levels for t-tests of the directional (+, -) difference in means between time periods.
                1 Weeks when planting and harvest take place each year based on USDA-NASS weekly crop progress and condition reports issued by state NASS offices.


                Share

                  Farmers weigh in on Nitrogen management in a changing climate

                  Climate and weather greatly impact a farmer’s day-to-day operations as well as their livelihood.  To gain perspective on farmers’ production practices and how they are changing, Michigan State University Extension educators and specialist invited farmers from across Michigan to participate in one of three discussions on sustainable corn production held at locations in the north central, central and south central part of the state during mid-March.  Climate and nitrogen were two of the topics discussed.

                  Concerns over heavy spring rains prompts Michigan corn growers to split N-applications throughout growing season.

                  Concerns over heavy spring rains prompts Michigan corn growers to split N-applications throughout growing season.

                  We found that producers have already decreased the amount of nitrogen applied per bushel of yield.  Cost of nitrogen, concern of environmental impacts, improved technology and better information were all given as reasons for the change.   The source of nitrogen used is also changing.  Most producers indicated that they will or have already moved away from using anhydrous mostly due to availability. Continue reading

                  Share

                    Water Chat

                    Water is an extremely valuable input in agriculture, whether delivered through rain, snow or irrigation. This fact was made very apparent during the kickoff presentation at the recent Iowa Water Conference.  In his presentation Water Issues in the Developing World, Dick Schultz (Iowa State University) detailed the different sources of water in our world.  While it seems that there is “water, water, everywhere”, only 3% of the world’s water is fresh water, the balance resides in the oceans.

                    Of that fresh water, 69% is in glaciers, 30% is groundwater, 0.3% lakes, 0.06% soil moisture, 0.04% in the atmosphere, 0.06% in rivers and 0.003% in the biosphere.  He went on to point out that 50% of the fresh water is in 6 areas: Canada, Russia, Tibet, Columbia, Brazil and Indonesia. freshwatersources

                    Water has been a hot topic in the US news with stories of the California drought, an extremely snowy winter in the east and nutrient reduction strategies in the Midwest.  A quick look at the Drought Monitor shows that drought conditions extend from California to Illinois. Continue reading

                    Share