July and August Rainfall in Missouri – The Tale of the Haves and the Have-Nots

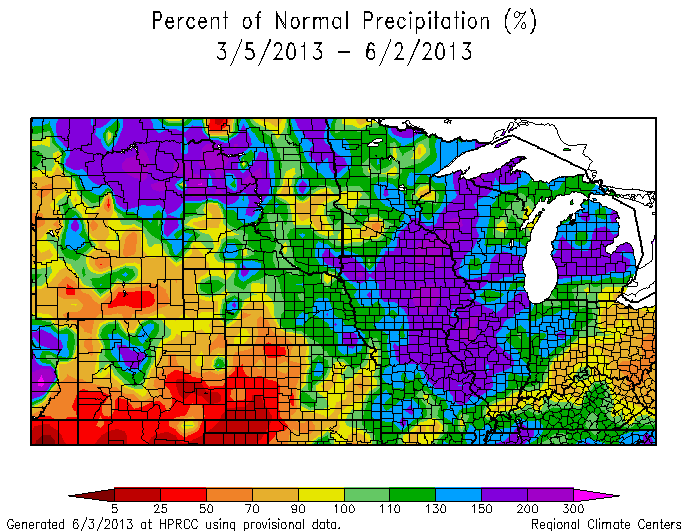
Missouri has experienced some large precipitation disparities this summer, ranging from moderate drought to historic flooding. The disparities have been especially notable in August. Some south central counties have received 15-20 inches of rain this month, whereas 120 miles to the north…not a drop.

Several counties across northern Missouri have received less than 2-inches of rain since July 1, which is more than 6-inches below normal. Crop stress has emerged in the driest areas, with some firing and leaf curling reported, more notably in upland areas, or in soils with higher clay or sand content. Cool July and August temperatures, in combination with below normal ET rates, have mitigated full drought stress potential but corn yields are declining due to the current high water demand of late planted corn, and during a critical growth stage. Soybean growth has also slowed down in these drier areas.

Unlike last year, below normal evaporative rates this spring and summer has had less impact on surface water supplies, and they remain mostly adequate despite the extended dry spell across northern Missouri.

For podcast, please visit:

<http://www.radiodeege.com/Podcasts/2013/08/19/july-and-august-rainfall-in-missouri-the-tale-of-the-haves-and-the-have-nots/>

For information on historic flood event across southern Missouri, please visit:

<http://www.crh.noaa.gov/sgf/scripts/localdata.php?loc=appevents&data=2013/2013aug10/summary.htm&format=noprint|nomenu&type=html>

Corn and Soybean Development in Illinois

Late planting and weather that continues to be cooler than normal has many wondering if the corn and soybean crops will reach maturity and harvest moisture within a reasonable time this fall. Emerson Nafziger, Principal Investigator on the Sustainable Corn project and Professor in Crop Sciences at the University of Illinois, offers his assessment in The Bulletin.

Spring state summary data (temperature and precipitation)

NOAA has released the state and regional summary information for the United States.  This information breaks down regions, states and climate divisions within state and ranks the temperature and preciptation information based on the last 119 years.  Just released today were the May and spring rankings.

The most significant features for the spring were the cold.  Top ten coldest for states from North Dakota down to Missouri, while not quite as cold in the rankings in the eastern corn belt.  Precipitation was top ten wettest for most states in the Upper Midwest with Iowa having the wettest spring on record.

Go to:

http://www.ncdc.noaa.gov/temp-and-precip/maps.php?

Precipitation maps show reason for planting delays

After the very serious drought issues throughout the corn belt during the growing season 2012, the opposite issues are impacting much of the corn belt this season with central parts of the corn belt delayed in planting compared to average and slow developing because of wet field.  The following map shows percent of average (normal) precipitation over the last 90 days.   Colors in green to blue and shades of purple are wet – purples more than 150% of average (or more than 1.5 times average precipitation).   Much of Iowa, Illinois and Missouri as well as western Indiana and southern Minnesota and parts of Wisconsin are the wettest area.  Embedded in some of these areas are spots with over 200% of average precipitation (more than double) the 30 year average.

90dPNormNWSCR

These states are the ones in the main part of the corn belt farthest behind in soybean planting according the USDA NASS reporting today.  Through 2 June the three states below are the most delayed in soybeans.

Illinois                   49%

Iowa                     44%

Missouri               36%

Other surrounding states are well ahead with even Indiana at 76%.

The drier areas surrounding (yellow to red) indicate drier than average conditions over the 90 days leading to better ability to do field work and plant (and where planting progress is more advanced).

Similar deviations show up at nearly all time frames from 30 days back to the beginning of the calendar year.  Harry Hillaker, Iowa State Climatologist has reported this being the wettest spring on record (March to May) at 16.65”.

If there is any consolation, it could be worse.  If this spring had happened after a particularly wet fall where soil moisture profiles had been completely refilled, conditions (and flooding) would have been more problematic.  Because of the dryness last year there was ample storage in the soil moisture profile and in surface water bodies in much of the area.

Planting Date Effects on Corn Silage Yield and Quality

Joe Lauer, University of Wisconsin – Madison

We have written quite a bit about planting date effects on corn grain yield (high moisture and dry corn).  What about its effects on corn silage?  As planting date becomes more delayed, there is an increased likelihood that fields intended for grain will be harvested for silage, especially if the year remains cool.

Figure 1. Corn forage yield response of full-season hybrids (104-108 RM) to planting date during 2003 to 2012 at Arlington, WI (N= 235 plots).

Figure 1. Corn forage yield response of full-season hybrids (104-108 RM) to planting date during 2003 to 2012 at Arlington, WI (N= 235 plots).

The grain yield response of full-season hybrids to planting date at Arlington for the last 10 years has been described previously.  These treatments were established using 8-row plots; four rows were harvested for silage Continue reading

Planting Progress

OLYMPUS DIGITAL CAMERACurrent planting progress released from the USDA National Ag Statistics tells the current story across the corn belt. Nationally, corn planting stands at 5%, mostly outside the main corn growing areas.  The I-states (Iowa, Illinois, Indiana) all only have a few percent planted per state. Average nationally planted by this point is over the last five years is 31%.

Cold conditions are slowing the planting progress limiting the ability of the soil to warm because of overall cool temperatures.  Continue reading

Drought of 2012-13 – Over or Not?

OLYMPUS DIGITAL CAMERABy Dennis Todey, State Climatologist, South Dakota… The answer to this question is largely a matter of location. For much of the eastern Corn Belt late season precipitation in the fall of 2012 reduced the impact of drought issues. Continuation of precipitation throughout the winter and into early spring has eliminated drought status on the US Drought Monitor and is creating wet conditions in locations along with flooding in some locations. In the central Corn Belt, the additional precipitation in the winter and early spring has reduced drought levels to slightly dry or moderate drought conditions. Western and northern parts of the Corn Belt still have large areas of D2-D4 drought conditions because of Continue reading

Speed Science

Want to learn a lot about crops, climate, culture, and change, all in a short period of time?  Check out the Speed Science Resources available on our website.  They include both factsheets and short videos and are approved for use in educational, research, and extension settings.  Factsheet topics vary from the nitrogen cycle, to cover crops, to drainage water management.  The videos cover climate change, soil core sampling, modeling and analysis of soil, and many other topics.  Here’s an example of a video.  Check it out and tell us what you think!